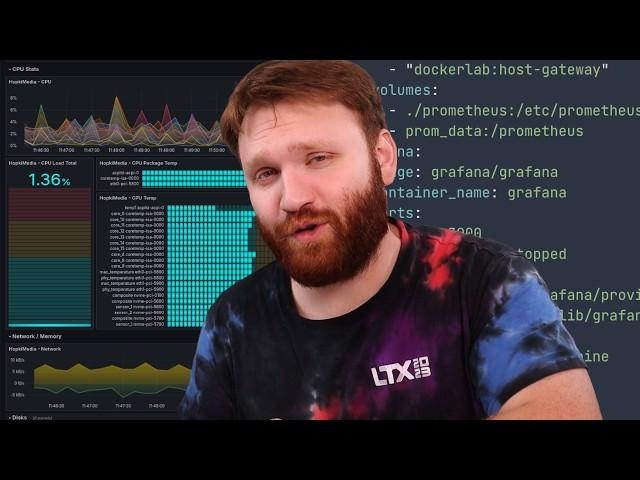
BEST Home Server Monitoring Setup! (Linux, Proxmox, Unraid, and more)
Комментарии:

Looks like the golift repo is gone. Alternative?
Ответить
I tried to set this up late last year and there was so much to learn that I gave up (prometheus has been running for 6 months monitoring nothing but itself 🫠). I wish I'd found this sooner!
Everything you've said here makes sense to me with what I've learned so far and I think I'll finally be able to set up the monitoring I was looking for. Thank you for the fantastic guide!

None
Ответить
Can this configuration work on a linux server machine?
Ответить
Thanks for sharing this tutorial! Absolutely awesome! Can't wait to implement this across my home lab stack.
Ответить
I'm asked to create our own one for my company without using of any of these external tools pls someone guide me 🙏
Ответить
Why not influxdb 3?
Ответить
Damn, not interested in using docker... pass!
Ответить
Why not use VictoriaMetricsDB as the metrics storing and indexing agent? It is more storage efficient, has superior scalability and long term data retention, and faster query performance.
Ответить
Why not just use netdata community?
Ответить
I subscribed you to follow up on the home media server you have, was looking foward to it but its just taking way too long for you to make a video on that. I'd love if you could make a video on that topic or maybe a series or a long tutorial video anything
Ответить
Thank you for this video, very informative.
Ответить
i've done this all in python
Ответить
dang this is pretty hefty
Ответить
I'm going to make an observation here about a lot of the self hosted videos coming out from content creators so please don't take offense. The tools you are showing are becoming things that need a server themselves to monitor the other servers. While I run all this stuff because I have the hardware to do so, running a full stack monitoring suite this large is kind of overkill, and consumes A LOT of resources. It just seems the "self-hosted" space is bloating horribly at this point.
Ответить
Awesome man!
Ответить
Holy smokes what are the odds that I refresh my page to look for new projects to take on and you happen to upload this gem. Thanks for the video amazing explanations.
Ответить
I wrote tutorial on my website about this solution a long time ago. We use Grafana at work but not only. For Zabbix I have pre-made templates for Fujitsu Primery and Eternus servers, so easier way. Anyway, yes it is doable in Grafana, but time consuming. Pre-made templates for Grafana are nice. What I like is Grafana Tempo that allows you to monitor behavior of the application running in Kubernetes cluster.
Ответить
Bros, i really appreciate the articles accompanying your flicks.
Ответить
Amazing, thank you!
Ответить
Have you tried netdata? All these metrics out of the box
Ответить
It looks like you're trying to provide a good amount of info to be applicable to people running all manner of homelab servers. For the beginner, this is of course much easier to deploy directly on an Unraid machine with its built-in Docker support. Everything from initial OS install to formatting disks, to container spin-up and configuration. I'd venture to say even spinning up Portainer on Unraid and then using that to manage the other containers may still be faster - and still easier. :)
Ответить
Nice video
what is the main difference between using a folder on the PC and using a Volume?

THANK YOU!!! This video will really help me get started.
Ответить


![Demon Girl [Prod Chavez] Demon Girl [Prod Chavez]](https://hdtube.cc/img/upload/VWEyRzc3Snc4WmY.jpg)


